An indicator is a compound that changes color when you dip it in different things, like vinegar, alcohol, milk, or baking soda mixed with water. There are several extracts you can use from different substances. You’ll find that not all indicators are affected by both acids and bases. Some only change color for just an acid, or just a base. Turmeric, for example, is only good for bases. (You can prepare a turmeric indicator by mixing 1 tsp turmeric with 1 cup rubbing alcohol.)
Easy Indicator Juice
Cut the substance you want to turn into your”indicator” into small bits. Boil the chopped substance for five minutes. Strain out the pieces and reserve the juice. Cap the juice (indicator) in a water bottle and you’re ready to go. What different substances can you use? We’ve had the best luck with red cabbage, blueberries, grapes, beets, cherries, and turmeric. You can make indicator paper strips using paper towels or coffee filters. Just soak the paper in the indicator, remove and let dry. When you’re ready to use one, dip it in part way to you can see the color change and compare it to the color it started out with.
Turn this into a science fair project! Make sure you only change ONE thing when you transform this into a science fair experiment…. you can change the type of substance you use, or the stuff you test with the indicator. For example, you could try beets, blueberries, grapes, cabbage, cherries, and turmeric and test lemon juice with the different pH strips. OR you could make a cabbage-based indicator and test lemon, limes, oranges, etc. Have fun!
In this blog article, I mentioned how you could measure the speed of light the easy way. Did you know there is an even EASIER way to do it? Check out this super-easy method – all you need is a microwave and food.
And I promise to share with you how to do it the hard way in Part 3.
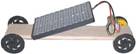
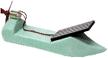
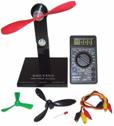
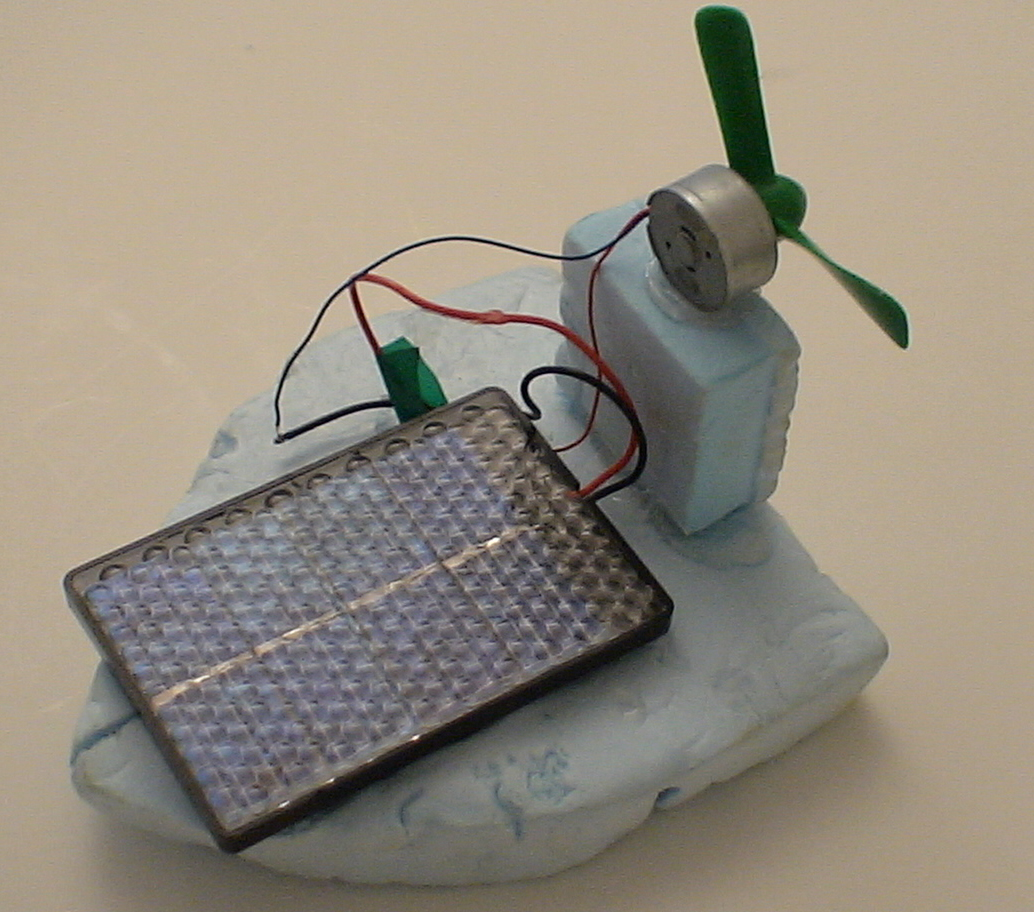
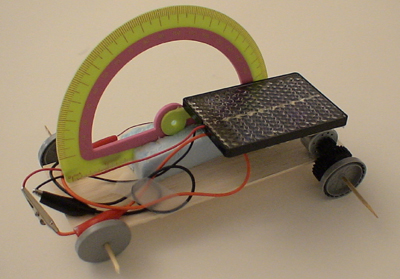
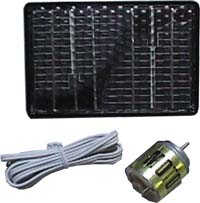
Being green is red-hot right now, so it’s not surprising how many emails we get asking how kids can do ultra-cool science fair projects on alternative energy. One of the best ways to start is to visit a toy store and pick up a kit that has a solar cell, solar motor, and propeller combination. Once you have these items, it’s easy to power things like race cars, solar boats, etc. Here are a few images from our own Solar Power science fair project kit to get you started on ideas:
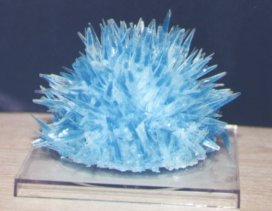
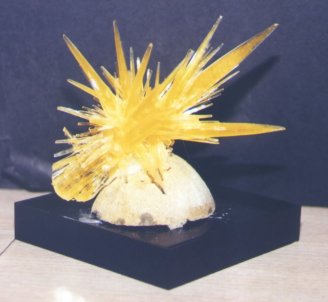
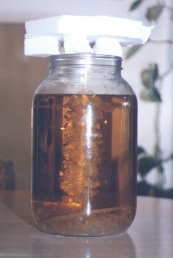
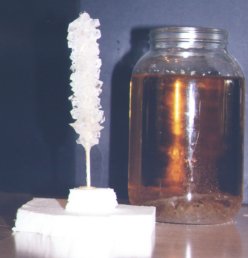
Take advantage of the process of crystallization to make candy! You’ll create a super saturated solution of sugar and use it to grow your own homemade sugar candy crystals. (A super saturated solution is one that has as much sugar dissolved in the water as possible. Note- if we didn’t heat the water, we’d wind up with only a saturated solution.)
Boil three cups of water in a large pot on the stove. Add eight cups of sugar, one cup at a time, slowly stirring as you go. The liquid should be thick and yellowish. Turn off the heat and let it sit for four hours (or until the temperature is below 120 degrees F). Pour the sugar water solution into clean glass jars and add a couple drops of food coloring (for colored crystals). Tie a string to a skewer, resting the skewer horizontally across the jar mouth. Let sit for a few weeks to a few months.
What kind of questions can you ask about this project? What happens when you vary the amount of water? Sugar? Time? Seed or not to seed the stick? Does it really matter how warm the environment is? What if you don’t heat the solution to dissolve more? Can you color the crystals? Why does the color stick (or not)? Does salt work instead of sugar? How about epsom salts? Does laundry detergent work, too?
The images below are sugar crystals, ammonia, and copper crystals.
If you have a relay from Radio Shack (Part #275-206 or similar), you can quickly form it into a buzzer with a DC power source. Remove the plastic housing so the connections are exposed (and you can clearly see which terminal is connected where.
Connect one coil terminal to ground (black battery wire), the other coil terminal to a place that connects to the clicker when not powered (rest position). Connect power (the red wire) to the clicker.
Can you find the spot where you get a nice zap when you touch it with your fingers? (Note – you may need more than 3V to make this work with your particular relay. Try 9 or 12V.)
Lay a row of naked straws parallel to each other on a smooth tabletop.Place two empty soda cans on the straws about an inch apart.Lower your nose to the cans and blow hard through the space between the two cans and *clink* they should roll toward each other and touch!
Why does this happen?When air moves, the pressure decreases.This creates a lower (relative to the surrounding air) air pressure pocket right between the cans.Recall that higher pressure pushes, and thus the cans clink together.Just remember – whenever there’s a difference in pressure, thehigher pressure pushes.
What kinds of questions can you ask about this project? For example: What types of cans work and don’t work? How much air pressure you you really need – would a hair dryer be a better choice?
So this is a more advanced project… and one that takes patience. There is an easy way and a hard way to do this project. I particularly like the hard way better, because there’s more observational science involved and less mathematics. But let’s start with the easy way first.
Easy Method for Measuring the Speed of Light In a transparent tupperware, make a batch of clear gelatin (like jell-o) and let it harden. Skimp on the water so the mixture is very firm. When ready, take it out of the fridge and shine a laser beam through the side of the tupperware… you’ll see the beam ‘bend’. Carefully measure the angles of incidence and refraction and use Snell’s law to back-calculate the speed of light.
For reference, the index of refraction for ice is 1.31; for water at 20 deg. C is 1.33; for diamond it’s 2.42; for plexiglass it’s 1.51. For your measurement to be completely accurate, you’ll need to remove the tupperware and measure it for the gelatin.
Once upon a time, people noticed some of the rocks on the planet stuck to other rocks… and soon after floated a shard of metal in water and noticed that it pointed the same direction no matter how you rotated the cup. We know today about the earth having a magnetic field that keeps the needle pointing in the same direction… at least, until a thunderstorm bolts through the area. When this happens, the needle spins around and doesn’t settle on any one particular area… a problem if you’re a sailor at sea.
Other things can cause small pockets of changing magnetic fields on the earth, such as solar storms. The sun burps and spits out high energy photons and other particles all the time, some of which make it to earth, but most of which harmlessly pass by. The ones we notice, however, happen when a magnetic loop on the sun snaps and breaks free, causing high energy particles to zoom toward earth. When this happens, we get the ‘aurorae’ at the poles and pockets of fluctuating magnetic fields that are detectable with a small homemade device called a magnetometer.
You’ll need one clear, plastic bottle (soda or large water bottle with the label removed), thin cotton thread, a small magnet, an index card, a tiny mirror or thin piece of mylar, one naked straw, glue, tape, scissors, yardstick or measuring tape, and a laser. The basic idea is this: using an amplifier (light shot over a distance), you can detect very small changes in the magnetic field using a magnet on a low-friction spring (the thread).
Attach the bar magnet onto the index card and glue the small mirror to the magnet. Suspend the card from the bottle cap with a length of thin string (you can test out fishing line, single fibers from nylon rope, sewing thread, etc.) and stick the whole thing inside a plastic bottle. (You can cut off the bottom of the bottle to use as a bell-jar.)
After the card settles down, it’s time to play with the experiment. Shine your laser on the mirror at a wide angle, and you should see a dot on the wall. Tape a piece of paper to the wall and carefully mark the position. Over the course of a few hours, you will notice the dot “move”. Mark the new locations with the time and date. Make sure you’ve got a wide angle – there should be at least 90 degreed between the incoming and outgoing laser beam.
What kind of questions can you think of to ask about this project?
I get a lot of questions about how to turn “cool” projects into a true science fair project, and lasers are one of the activities people really want to know about. So here are the basics:
The word “LASER” stands for Light Amplification by Stimulated Emission of Radiation. A laser is an optical light source that emits a concentrated beam of photons. Lasers are usually monochromatic – the light that shoots out is usually one wavelength and color, and is in a narrow beam. By contrast, light from a regular incandescent light bulb covers the entire spectrum as well as scatters all over the room. (Which is good, because could you light up a room with a narrow beam of light?) A laser controls the way energized atoms release photons.
Quick note about lasers: cheap key chain lasers (like from “dollar” or “thrift” stores) work just fine with these projects. Do not use green lasers – they can cause permanent eye damage.
For starters, take your laser and zip around the house before bedtime finding cool things to shoot your laser at (or through). Try clear bottles filled with different liquids (soap, milky water, vinegar, rubbing alcohol etc.). Try lamps, (dark) clear light bulbs, windows, cut acrylic or crystal pieces, CDs, eyeglasses, saran wrap, colored cellophane, feathers, aluminum foil, and the mirrors in the bathroom Once you find a cool effect, start your scientific investigation by honing in on a question you want answered – something that came up when you were playing with your laser.
One question that pops out naturally when we teach the Lasers class for kids is: “Does the beam pass through the window or reflect back?” And when looking up the answer, we found that it did both (during our research step), which triggered another question about how lasers interacted with mirrors, from which we formulated the question and later our hypothesis…
Hopefully this gives you ideas and gets you started!
Since time is money, and you have neither if you’re kid on the night before your not-yet-started science fair project is due, we’ve got a secret recipe for success that could earn you the last-minute grade.
Topic: Aeronautics
Shopping List:
Copy paper, white and colored
Paperclips
Tape, scissors
Cardboard for your display (can be from an old box)
Digital camera (major plus if you have one)
Computer, printer, paper (and photo paper if you have it)
One hour
Background information: Every flying thing, whether it’s an airplane, spacecraft, soccer ball, or flying kid, experiences four aerodynamic primary forces: lift, weight, thrust and drag. An airplane uses a propeller or jet engine to generate thrust. The wings to create lift. The smooth, pencil-thin shape minimizes drag. And the molecules that make up the airplane attributes to the weight.
Think of a time when you were riding in a fast-moving car. Roll down the window and stick your hand out, palm down. Notice how easily the wind slips over your hand. Now turn your palm facing the horizon. Which way do you feel more force against your hand?
When designing airplanes, engineers pay attention to details, such as the position of two important points: the center of gravity and the center of pressure (also called the center of lift). On an airplane, if the center of gravity and center of pressure points are reversed, the aircraft’s flight is unstable and somersaults into chaos. (The same is true for rockets and missiles!)
STEP #1 Getting Started Grab a sheet of paper and fold your best paper airplane design right now. This article is a step-by-step process on taking you from idea to exhibit, so don’t just keep reading… grab the paper and fold!
Need help getting started? Watch the video below to learn how to make stunt planes, jets, and hang gliders):
Now take your plane and balance it on your finger. Where does it balance?
Grab a hair dryer and using the cool setting (so you don’t scorch your plane), blast a jet of air up to the ceiling. Put your airplane straight-and-level into the jet of air, and using a pencil tip on the top side of your plane, find the point at which the airplane perfectly balances while in the airstream.
Which one is closest to the nose?
Besides paying attention to the CG and CP points (and their relation to each other, as in ‘which one is closest to the nose?’), aeronautical engineers need to figure out the static and dynamic stability of the airplane… which is a complicated way of saying whether it will fly controllably or oscillate out of control during flight.
Airplanes usually balance (e.g. have their CG point) around the wings. Ever wonder why the engines are at the front of small airplanes? The engine is the heaviest part of the plane, and engineers use this weight for balance, because the tail (elevator) is actually an upside-down wing which pushes the tail section down during flight.
Positive stability means that the plane is designed so that if you jam on the controls during straight and level flight (e.g. pitch up hard), and then let go, the airplane will return to (more or less) straight and level flight. That process works like this: When an airplane in level flight suddenly pitches the nose up, the wind speed over the wings slows and decreases the lift from the plane, which causes the nose to tip downwards, which causes the wind to rush over the wings again, creating more lift. This cycle eventually dampens out and the airplane is flying level again.
If, however, you have a negative stability (meaning that your CG is aft of the CP), then when you pitch up suddenly, the aircraft may do one of several things… all of which require sick bags and a parachute. One of the worst cycles is this: When the tail-heavy plane pitches down, the speed over the wings increases and provides more lift but only briefly, because the tail-heavy plane pitches the nose up (automatically by design) and keeps the nose up until the wind speed slows down so much that the winds stall (lift is no longer generated by wind flowing over the wings because there is no wind) and the airplane “falls†a distance until the air flows back over the wings, generating a lot of lift very quickly until the tail section tilts the nose back up, and the cycle continues to worsen each time – greater “fall†distances†and huge structural forces on the fuselage (body) until you jump ship.
The great news is that many of these unsettling things have been figured out a long time ago by two amazing people: the Wright brothers. They are also the ones who took an airfoil (fancy word for “airplane wingâ€), turned it sideways and rotated it around quickly to produce the first real propeller that generated an efficient amount of thrust. (Before this time, people had been using the same ‘screw’ design created by Archimedes in 250 BC… over 2,000 years ago we’ve had about the same propeller design without much improvement made along the way…) The twist in the propeller design was also a unique invention from the Wright brothers, and modern propellers are only 5% more efficient than those created a hundred years ago by the two brilliant brothers.
STEP #2 The Question: Okay, so how can you turn these ideas into a science fair project? Well, first you need to come up with a question, or a hypothesis. Here are a few examples to get you started… you can use one of these, or make up your own:
Does the CG need to be aft the CP for stable flight?
What dihedral angle (wing flex angle, more on that later) is best for long flights?
Does wing area affect time aloft?
How does elevator trim affect straight-and-level flight?
STEP #3 The Materials & Methods: Your project is deceptively simple… and very complex once you get into it (as you can see by the introduction section). You’re now making flying paper machines (paper airplanes) through the eyes of an engineer. So get a sheet of paper and make your best design right now and throw them around the room. When you’re done, click here to watch a short video on how to make our favorite flying designs. When you settle on a design you really like, you need to figure out what you are going to test (and change), and how you are going to measure it.
For example, if you want to measure the effect of moving a weight around on your airplane (you could simulate this by clipping a paper clip onto various parts of the airplane), the control would be no paperclip, and your vairable (the thing you’re testing) would be location of ONE paperclip. (If you start adding in more thn one paperclip, you’re now testing not only the location but the size of the weight, and this requires a whole separate testing procedure using the Scientific Method).
Another example: If you wanted to figure out how the dihedral angle affects your flight, your control is zero dihedral (wings are flat), and your variable would be to test different angles both flexed above and below the horizontal position, using a protractor to measure your angles.
If you wanted to test the position of the CP and the CG, you’ll need to find a way to move the CG of the plane without affecting other things, such as wing shape. (Paperclips are good ways to shift the weight of a plane.)
Once you’ve settled on a variable (thing you are going to test) and a control (baseline), you can go to the next step.
STEP #4 Taking Data: Across the top of the page, write down the stuff that does NOT change during your experiment. You need to record as much detail as possible, so if someone else wants to recreate your experiment, they have enough information to go on. At the top of your page, include specifics, such as:
Your name (silly, yes.. and essential)
Date and time of day
Weather conditions (and wind speed, if you’re doing this outdoors – check the weather online for exact measurements if you don’t have a thermometer…
Airplane geometry that does not change throughout your entire experimentation process. This could be the wingspan (AKA chord length, which is the longest line you can draw across the wings from tip to tip), wing area (you can estimate this using math and geometry, or use a sheet of grid paper and count up the squares the area of the wing covers up), weight of paper (one sheet = 1 ounce, or 0.014 pounds), dihedral angle (use a protractor – this idea is covered in the video), wing flap (elevator or aileron) position (up, down, neutral), location of CG and CP points (see above details on how to do this).
Draw a line under all this information, and using a ruler,make yourself a table (grid) for taking your data underneath your information. You’ll need columns for the things you are testing for, which could be:
Trial # (1, 2, 3 etc…)
What you changed (number of paperclips, position of paperclips)
Time aloft (seconds)
Distance traveled (feet)
Position of CG and/or CP
Performance (pitch up/down, yaw up/down (rotation about the vertical axis), roll up/down, and did it do so fast or slow?)
Dihedral angle (in degrees, positive or negative)
STEP #5 The Experiment: The fun part! Start throwing your airplane around and jot down your results. Although steps # 3 and #4 seem like a headache, they really set you up for successful tracking and data-taking for this part. Take LOTS of photos of your experiment, you, and anything else that will clearly demonstrate what you’re doing.
Think of it this way… you took care of all the detail work upstream, so when some part of your experiment actually works right, you can say, ‘Oh, that’s what I did!’Â Speaking of which… if you’ve completed your table, it’s now time to jump to the next step.
STEP #6 The Results: Check over that table now… what do you find? Where did your airplane perform the best? Fly the highest? Zoom for the longest length of time? It’s a lot easier to see when you write it down… but it’s even easier when you chart your data on a graph. So go fire up your computer or grab another sheet of paper and mark out a grid.
You’ll want to choose a graph that shows whatever shows off your results the best. You might have to play around with options here (which is why the computer is great here). For more qualitative results, you can add in a “Performance Scale” and rate your plane’s performance from 0 to 10, and plot your dihedral angle on the horizontal scale and the performance rating on the vertical scale. Don’t forget to add in units to your scales – if you’re plotting time aloft, make sure to add in the word ‘seconds’ somewhere, so people know what unit of measurement you’re referring to. For example, if you’re charting “Distance Traveled” on one scale, is it meters or feet, or even miles you’re using to measure your plane’s performance?
And don’t worry if your numbers are not as you expected. One of the biggest mistakes you can make is to fudge your data to match your hypothesis. DON’T EVER do this!! You miss out on learning something new, and fudging is not doing real science.
STEP #7 The Conclusion: This is where you look at your results and answer your original question. Personally, I like a concise, one-sentence conclusion that says it all. After reading hundreds (if not thousands) of engineering reports, the accurately-stated one-liners are the winners. If I want more detail, I’ll read the whole report.
STEP #8 Recommendations: This is a nice way to end the report. Recommendations basically answer this one question: “If you had more time, what would you test next?” Maybe you’d test the number of paperclips, now that you know their ideal location. Or maybe you’d play with the CP now that you know the best CG spot. Whatever it is, jot it down on your paper.
STEP #9: Presenting Your Report/Building a Display Board: You’re now ready to build your display board, write your report, and learn how to present your findings. We’ve talk more about this in another article, as this one is getting rather long! See you soon!!
Hi! I'm Aurora, and I am a mechanical engineer, university instructor, private pilot, astronomer, and work on real rockets. I spend my time getting kids crazy-wild about science by taking them from bored to brainiac in less time than it takes to burn toast.